 Images
baoyu-infographicAuthor style study
Bridge the gap
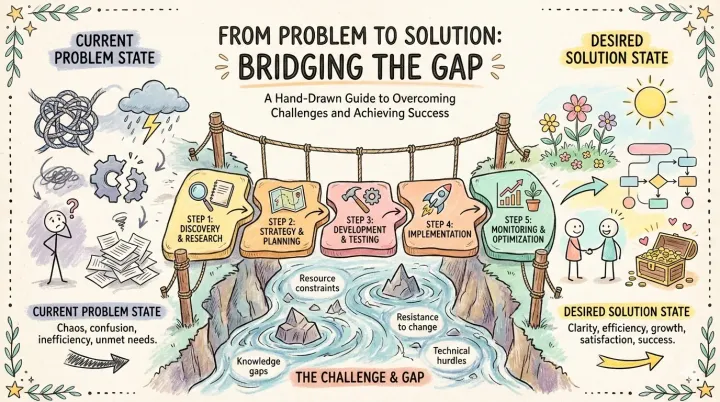
Map a current problem, the obstacles and a desired outcome as a bridge. Label the actions that connect both sides.
Made with skills
Discover the work, meet its creators, and make something of your own.
100 selected examples · 14 skills & workflows
12 examples · Showing 1–12 · “baoyu-infographic”
ImagesMap a current problem, the obstacles and a desired outcome as a bridge. Label the actions that connect both sides.
 Images
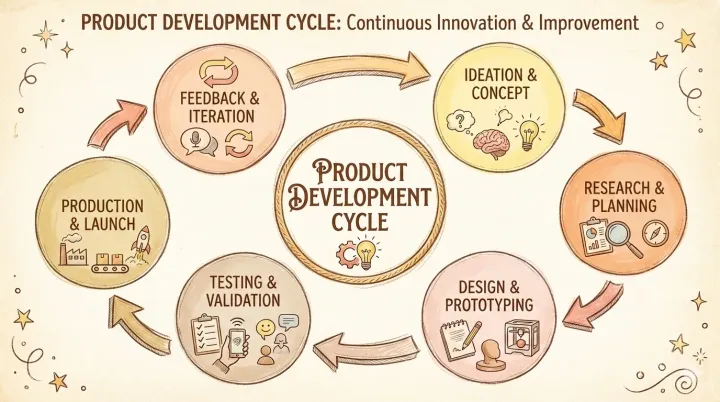
Explain a product development cycle from research to launch and feedback, with an unambiguous reading direction.
 Images
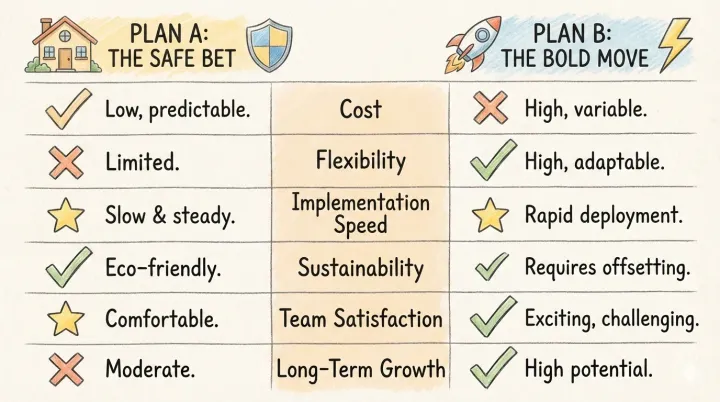
Compare two proposals against the same six criteria. Separate supplied facts from undecided trade-offs.
 Images
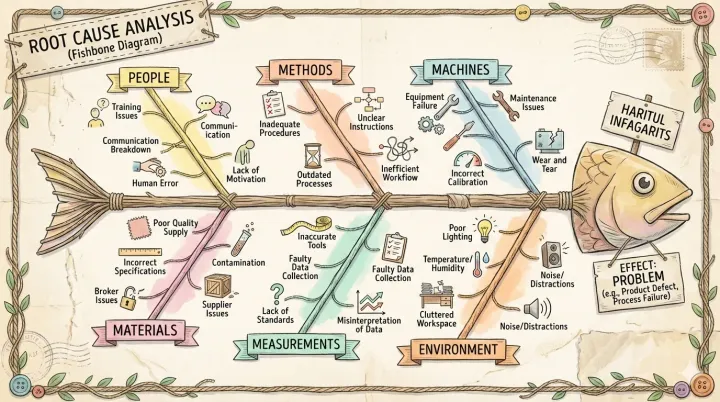
Organize possible causes under people, process, tools and environment. Distinguish hypotheses from verified causes.
 Images
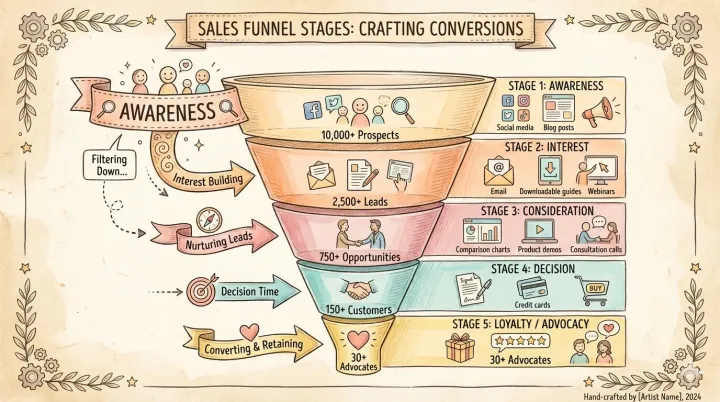
Visualize awareness, interest, consideration, decision and retention with supplied counts and explicit conversion denominators.
 Images
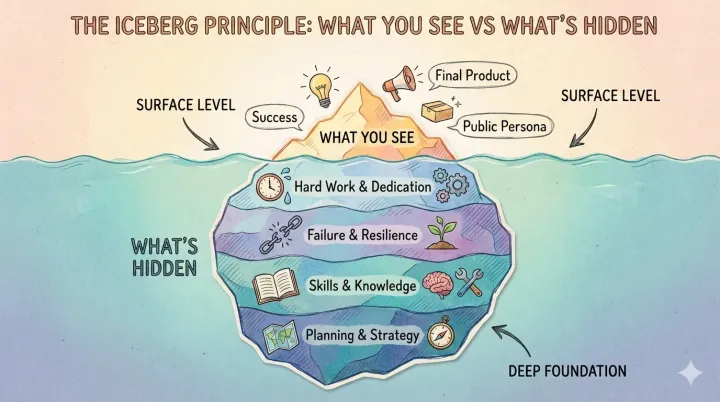
Separate visible outcomes from supporting work, constraints and learning below the surface.
 Images
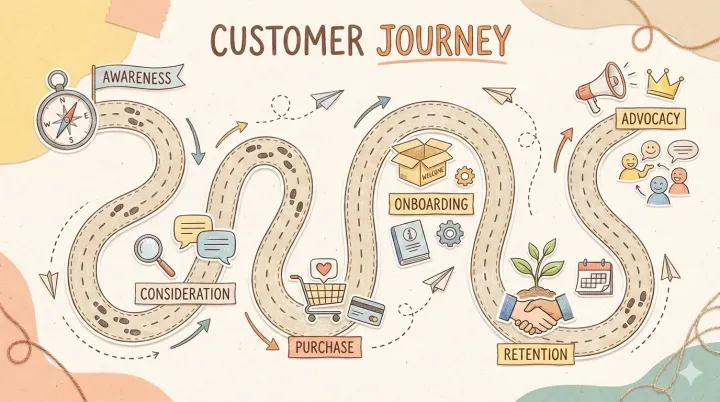
Map customer touchpoints from discovery to advocacy, pairing each stage with a question and an opportunity.
 Images
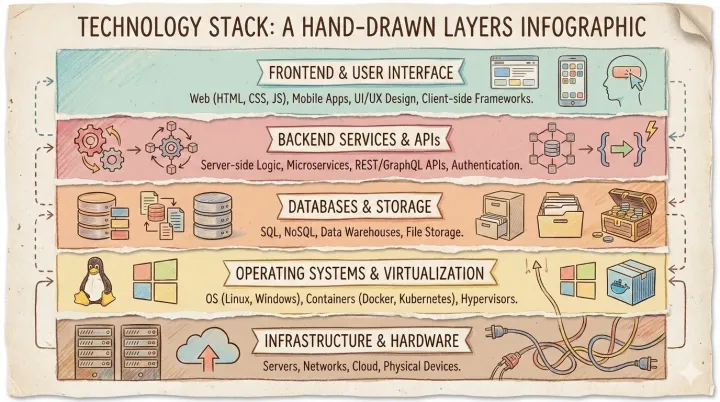
Explain an application stack from infrastructure to interface, showing responsibilities and dependencies rather than decorative jargon.
 Images
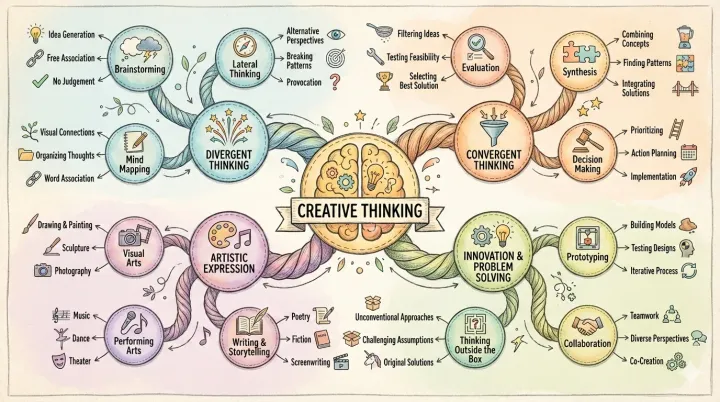
Organize a central concept into distinct branches, subtopics and useful cross-links without repeating the same idea.
 Images
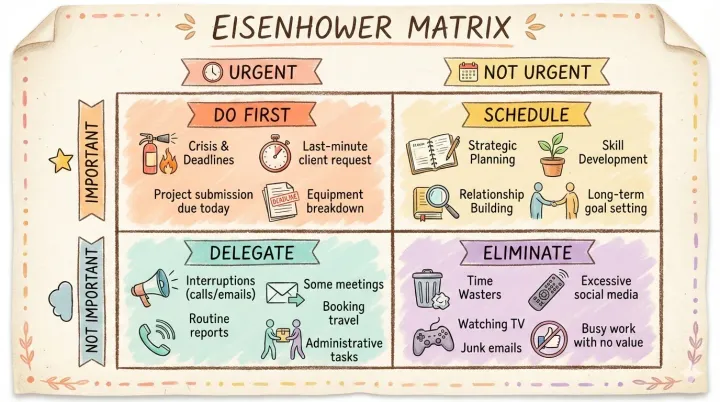
Place tasks on an urgency-versus-importance matrix and label do, schedule, delegate and drop decisions.
 Images
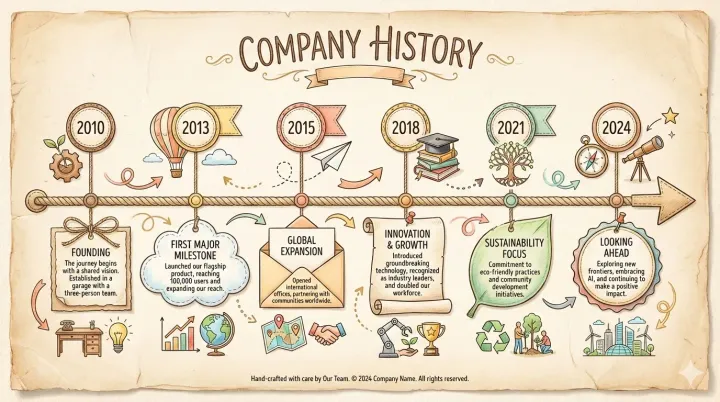
Turn dated milestones into a horizontal timeline. Preserve actual dates and keep unsupported achievements out.
 Images
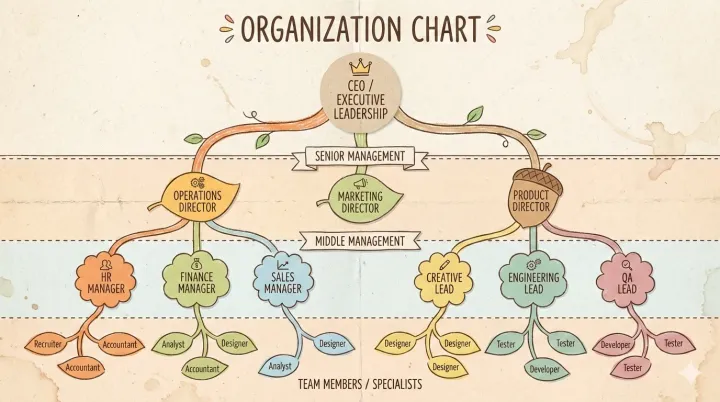
Draw an organization tree with supplied roles and reporting lines. Keep one level per visual tier.
Curated work, reusable templates and style studies are labeled separately, alongside work made here. Each names its source, requirements and prompt status. Author previews are not platform retests; multiple views of one work count once.
Explore the skill registryMade with skills
Discover the work, meet its creators, and make something of your own.
100 selected examples · 14 skills & workflows
12 examples · Showing 1–12 · “baoyu-infographic”
ImagesMap a current problem, the obstacles and a desired outcome as a bridge. Label the actions that connect both sides.
ImagesExplain a product development cycle from research to launch and feedback, with an unambiguous reading direction.
ImagesCompare two proposals against the same six criteria. Separate supplied facts from undecided trade-offs.
ImagesOrganize possible causes under people, process, tools and environment. Distinguish hypotheses from verified causes.
ImagesVisualize awareness, interest, consideration, decision and retention with supplied counts and explicit conversion denominators.
ImagesSeparate visible outcomes from supporting work, constraints and learning below the surface.
ImagesMap customer touchpoints from discovery to advocacy, pairing each stage with a question and an opportunity.
ImagesExplain an application stack from infrastructure to interface, showing responsibilities and dependencies rather than decorative jargon.
ImagesOrganize a central concept into distinct branches, subtopics and useful cross-links without repeating the same idea.
ImagesPlace tasks on an urgency-versus-importance matrix and label do, schedule, delegate and drop decisions.
ImagesTurn dated milestones into a horizontal timeline. Preserve actual dates and keep unsupported achievements out.
ImagesDraw an organization tree with supplied roles and reporting lines. Keep one level per visual tier.
Curated work, reusable templates and style studies are labeled separately, alongside work made here. Each names its source, requirements and prompt status. Author previews are not platform retests; multiple views of one work count once.
Explore the skill registryMade with skills
Discover the work, meet its creators, and make something of your own.
100 selected examples · 14 skills & workflows
12 examples · Showing 1–12 · “baoyu-infographic”
ImagesMap a current problem, the obstacles and a desired outcome as a bridge. Label the actions that connect both sides.
ImagesExplain a product development cycle from research to launch and feedback, with an unambiguous reading direction.
ImagesCompare two proposals against the same six criteria. Separate supplied facts from undecided trade-offs.
ImagesOrganize possible causes under people, process, tools and environment. Distinguish hypotheses from verified causes.
ImagesVisualize awareness, interest, consideration, decision and retention with supplied counts and explicit conversion denominators.
ImagesSeparate visible outcomes from supporting work, constraints and learning below the surface.
ImagesMap customer touchpoints from discovery to advocacy, pairing each stage with a question and an opportunity.
ImagesExplain an application stack from infrastructure to interface, showing responsibilities and dependencies rather than decorative jargon.
ImagesOrganize a central concept into distinct branches, subtopics and useful cross-links without repeating the same idea.
ImagesPlace tasks on an urgency-versus-importance matrix and label do, schedule, delegate and drop decisions.
ImagesTurn dated milestones into a horizontal timeline. Preserve actual dates and keep unsupported achievements out.
ImagesDraw an organization tree with supplied roles and reporting lines. Keep one level per visual tier.
Curated work, reusable templates and style studies are labeled separately, alongside work made here. Each names its source, requirements and prompt status. Author previews are not platform retests; multiple views of one work count once.
Explore the skill registryMade with skills
Discover the work, meet its creators, and make something of your own.
100 selected examples · 14 skills & workflows
12 examples · Showing 1–12 · “baoyu-infographic”
ImagesMap a current problem, the obstacles and a desired outcome as a bridge. Label the actions that connect both sides.
ImagesExplain a product development cycle from research to launch and feedback, with an unambiguous reading direction.
ImagesCompare two proposals against the same six criteria. Separate supplied facts from undecided trade-offs.
ImagesOrganize possible causes under people, process, tools and environment. Distinguish hypotheses from verified causes.
ImagesVisualize awareness, interest, consideration, decision and retention with supplied counts and explicit conversion denominators.
ImagesSeparate visible outcomes from supporting work, constraints and learning below the surface.
ImagesMap customer touchpoints from discovery to advocacy, pairing each stage with a question and an opportunity.
ImagesExplain an application stack from infrastructure to interface, showing responsibilities and dependencies rather than decorative jargon.
ImagesOrganize a central concept into distinct branches, subtopics and useful cross-links without repeating the same idea.
ImagesPlace tasks on an urgency-versus-importance matrix and label do, schedule, delegate and drop decisions.
ImagesTurn dated milestones into a horizontal timeline. Preserve actual dates and keep unsupported achievements out.
ImagesDraw an organization tree with supplied roles and reporting lines. Keep one level per visual tier.
Curated work, reusable templates and style studies are labeled separately, alongside work made here. Each names its source, requirements and prompt status. Author previews are not platform retests; multiple views of one work count once.
Explore the skill registry